Beyond the Dashboard: Why Metrics-Heavy Monitoring Architectures Are Failing Modern Engineering Teams
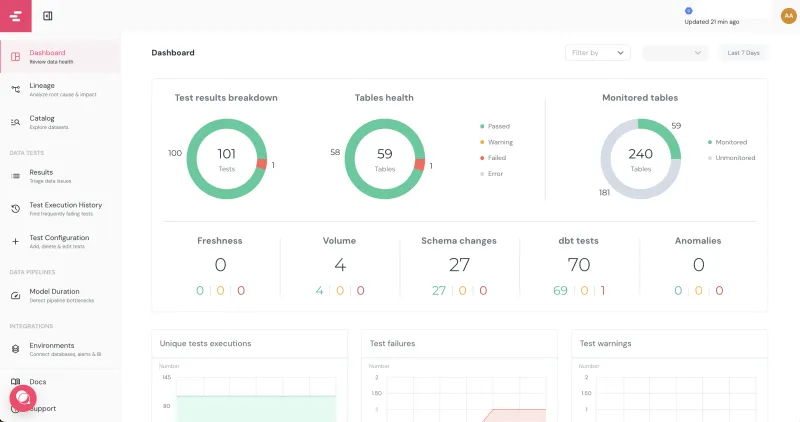
Photo: software observability dashboard data visualization engineering team, via res.cloudinary.com
There is a particular kind of engineering meeting that many practitioners will recognize: the post-incident review where the first question asked is not "why did this fail?" but "why didn't our alerts catch it?" The team pulls up a Grafana dashboard populated with dozens of carefully crafted panels. CPU utilization looked normal. Memory pressure was within bounds. Error rate graphs show nothing unusual until well after users had already begun reporting problems. The monitoring stack generated no actionable signal. The incident was discovered through a customer support ticket.
This failure mode is not a configuration problem. It is an architectural one—and it is far more common than the industry's enthusiasm for monitoring tooling would suggest.
Monitoring and Observability Are Not Synonyms
The conflation of monitoring and observability has become one of the more consequential semantic errors in contemporary software engineering. Both terms appear in job descriptions, architecture review documents, and vendor marketing with sufficient interchangeability that the distinction has been effectively erased in many organizations. That erasure carries a practical cost.
Monitoring, in the precise sense, is the practice of collecting predefined metrics about known system states and alerting when those metrics cross predefined thresholds. It is inherently a hypothesis-first discipline: you must anticipate what can go wrong before you can instrument for it. Monitoring answers the question "is the thing I expected to break, breaking?"
Observability—a term borrowed from control systems theory, where it describes the degree to which a system's internal states can be inferred from its external outputs—is a different property entirely. A system is observable to the extent that engineers can ask arbitrary questions about its behavior at runtime without having anticipated those questions during instrumentation. Observability answers questions that were not formulated until after something went wrong.
The distinction matters because modern distributed systems fail in ways that are frequently novel. A microservices architecture with 40 services and several hundred inter-service call paths produces a combinatorial space of potential failure modes that no monitoring configuration can fully anticipate. Teams that invest exclusively in metrics collection are building a system optimized for detecting known failure patterns in an environment where the most costly failures are unknown ones.
The Over-Investment in Metrics, Under-Investment in Cardinality
Data from Honeycomb's State of Observability survey, which sampled over 600 engineering professionals across the United States, found that 78 percent of respondents rated their metrics collection capabilities as "mature" or "advanced," while only 31 percent said the same about their distributed tracing implementations. Fewer than 20 percent reported using high-cardinality event data as a primary debugging tool.
This distribution reflects an industry that has optimized for the legible and the familiar. Time-series metrics are conceptually straightforward, tooling ecosystems around Prometheus and Grafana are mature and well-documented, and dashboards produce the visual artifacts that communicate competence in organizational settings. High-cardinality event tracing, by contrast, requires a more significant shift in how engineers think about instrumentation—and the tooling, while improving rapidly, is less standardized.
The operational consequence is a telemetry architecture that produces high volume but low resolution. A metric recording the 99th-percentile latency of an API endpoint tells an engineer that something is slow for some users under some conditions. A structured trace, enriched with high-cardinality attributes—user ID, tenant ID, feature flag state, upstream service version, request path—tells an engineer exactly which users are experiencing slowness, under which precise conditions, and which service in the call chain is responsible. The former requires further investigation; the latter is frequently sufficient to identify the root cause directly.
Observability Maturity: A Practical Framework
Engineering organizations can assess their observability posture against a four-level maturity model that maps investment patterns to diagnostic capability.
Level 1 — Reactive Metrics: The team collects infrastructure and application metrics, operates dashboards, and responds to threshold-based alerts. Debugging requires manual log correlation. Mean time to resolution is measured in hours to days for novel failure modes.
Level 2 — Structured Logging: Logs are emitted in structured formats (JSON with consistent schema) and aggregated into a searchable platform. Engineers can filter by service, environment, and error type. Debugging improves but remains slow when failures span multiple services.
Level 3 — Distributed Tracing: Requests are traced across service boundaries using a consistent correlation ID. Engineers can reconstruct the execution path of individual requests. Latency attribution becomes tractable. This level typically corresponds to adoption of OpenTelemetry for instrumentation, which has become the dominant vendor-neutral standard for trace and metric collection as of 2024.
Level 4 — High-Cardinality Event Observability: The team instruments applications to emit rich, structured events with high-cardinality attributes. Tooling supports arbitrary slice-and-dice queries against event data without requiring pre-aggregation. Engineers can identify the specific subset of requests exhibiting anomalous behavior—by customer, by request parameter, by runtime environment—without knowing in advance which dimension is relevant.
Benchmark data from Charity Majors and the team at Honeycomb suggests that organizations operating at Level 4 report mean time to resolution figures 60 to 80 percent lower than those at Level 1 for incidents involving novel failure modes. For known failure patterns, the gap narrows considerably—which is precisely the point. Monitoring handles known failures adequately. It is the unknown failures that break SLAs and exhaust on-call engineers.
What Migration Actually Looks Like
Transitioning from a monitoring-centric architecture to genuine observability is not a rip-and-replace operation. Organizations that have executed this transition successfully tend to follow an incremental path that preserves existing investments while layering new capabilities.
The first practical step is adopting OpenTelemetry as the instrumentation standard across new and actively maintained services. OpenTelemetry's vendor-neutral SDK means that instrumentation work is not tied to any specific backend, which preserves optionality as the tooling landscape continues to evolve. For teams currently using proprietary agents from Datadog, New Relic, or Dynatrace, OpenTelemetry-compatible layers exist that allow parallel operation during transition.
The second step is identifying one high-value service—typically a critical API gateway or a service involved in recent incidents—and instrumenting it with high-cardinality event emission. Running a structured post-incident analysis against event data, compared against the same incident reconstructed from metrics and logs, provides a concrete internal benchmark for the diagnostic value of the new approach.
The third step, which many organizations delay too long, is retiring redundant metric collection. A common failure mode in observability migrations is operating both systems indefinitely, which doubles telemetry costs without delivering the clarity that comes from committing to the richer data model. Identifying metric dashboards that have not been viewed in 90 days—a query that most observability platforms support directly—typically surfaces significant reduction opportunities.
The Measurement Problem Behind the Measurement Problem
There is an uncomfortable irony embedded in this analysis: the engineering industry's preference for monitoring over observability is itself a product of measurement bias. Monitoring stacks are easy to evaluate. Dashboard count, alert volume, and uptime percentage are all legible metrics that appear in quarterly business reviews. The diagnostic quality of a telemetry architecture—its capacity to help engineers answer questions they have not yet thought to ask—is far harder to quantify before an incident reveals the gap.
Organizations that have made the transition consistently report that the most persuasive internal argument was not architectural theory but a single incident where high-cardinality trace data reduced a multi-hour debugging session to under fifteen minutes. The challenge is creating the conditions for that demonstration before the next significant outage makes the case by force.
The data on this is clear enough: teams are not under-monitored. Many are, in a meaningful sense, over-monitored and under-observable. Redirecting investment from additional metric coverage toward richer event instrumentation is not a speculative architectural bet—it is a well-documented path to faster incident resolution and more resilient systems.