When Logging Infrastructure Becomes the Liability: Diagnosing the Collection-to-Intelligence Gap
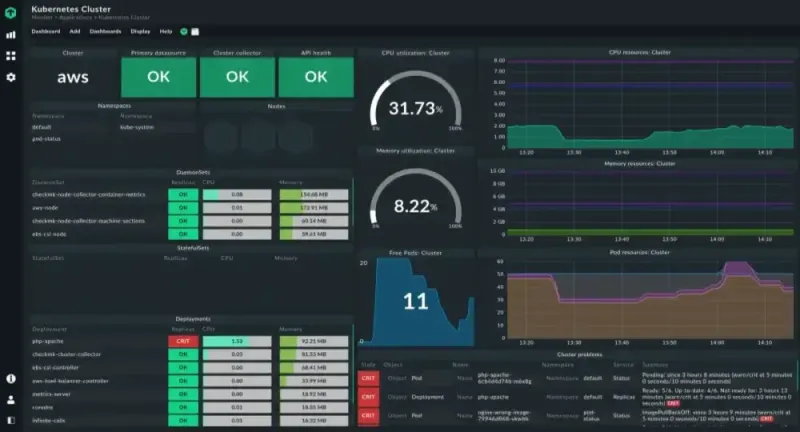
Photo: server room log data infrastructure monitoring dashboard, via images.ctfassets.net
There is a persistent assumption embedded in the culture of modern infrastructure engineering: if you are collecting logs, you are monitoring your systems. This assumption is wrong, and the consequences of holding it are measurable in downtime, mean time to resolution (MTTR), and, in regulated industries, compliance exposure.
Across engineering organizations of varying scale—from mid-market SaaS providers to large financial services firms operating on-premises infrastructure—a pattern emerges with uncomfortable regularity. Teams accumulate log data at extraordinary velocity while simultaneously losing the capacity to extract signal from that noise. The pipeline fills. The dashboards light up with ingestion metrics. And somewhere beneath the volume, a critical failure begins its quiet progression toward a production incident.
The Ingestion Illusion
Log aggregation platforms—Elasticsearch, Splunk, Loki, and their commercial equivalents—are sophisticated tools, and their sophistication can be deceiving. The ease with which modern pipelines ingest, index, and store telemetry data creates a false sense of operational coverage. Engineering leaders see terabytes flowing through their systems and interpret throughput as readiness.
But collection is not comprehension. A 2023 analysis by a prominent DevOps research consortium found that organizations processing more than 500 GB of log data per day were statistically less likely to detect anomalies within the first 30 minutes of onset than teams operating with more constrained, curated pipelines. The mechanism behind this counterintuitive result is straightforward: high-velocity ingestion without proportional investment in query optimization, retention policy governance, and alert logic engineering produces systems that are technically functional but operationally inert.
The logs exist. The insights do not.
Case Pattern: Detection Delay as a Logging Failure
Consider the following incident pattern, reconstructed from post-mortem documentation shared within the SRE community over the past two years. A distributed payment processing platform experienced a cascading failure in its message queue infrastructure. The failure was gradual—queue depth increased incrementally over roughly four hours before consumer lag reached a threshold that caused downstream service degradation visible to end users.
The logging infrastructure was operational throughout. Every relevant service was emitting events. Queue depth metrics were being captured. The problem: the alert threshold for queue consumer lag had been calibrated against historical peak traffic from eighteen months prior. The system had since scaled, and the baseline had never been recalibrated. The alert that should have fired at the two-hour mark did not fire until the six-hour mark, by which point the incident had already escalated to executive visibility.
This is not a story about bad infrastructure. It is a story about a logging system that had drifted from operational relevance without anyone noticing—because no one had built a process to notice.
Log Velocity and Alert Fatigue: A Quantified Relationship
The relationship between log volume and alert fatigue has been studied with increasing rigor over the past several years. Data from the 2024 State of Observability Report, published by an industry working group, indicated that engineering teams receiving more than 1,000 automated alerts per week were suppressing or ignoring approximately 62% of them. More critically, teams with the highest log ingestion volumes reported the highest rates of alert suppression—not because their systems were more stable, but because the signal-to-noise ratio had degraded to the point where alert triage itself became a cognitive burden.
The irony embedded in this data is precise: the more aggressively an organization logs, the more likely it is to miss something important. Volume, absent structure, produces entropy rather than intelligence.
Some teams attempt to resolve this through alert deduplication and correlation engines. These tools add value, but they introduce their own failure modes—particularly when correlation rules are not maintained as system architecture evolves. A correlation rule written to surface a specific failure pattern in a monolithic application may produce false negatives when the same service has been decomposed into microservices. The rule is still running. The pattern it was designed to catch no longer maps to the system it is supposed to protect.
A Diagnostic Framework for Evaluating Log System Health
Engineering organizations benefit from periodically subjecting their logging infrastructure to the same scrutiny applied to application code. The following framework offers a structured starting point.
1. Retention and Query Performance Audit Can on-call engineers execute the queries they need during an active incident within an acceptable time window? If complex queries against recent log data consistently exceed 30 seconds, the indexing strategy requires evaluation. Slow queries during incidents are not a performance inconvenience—they are a detection delay.
2. Alert Baseline Recalibration Cadence When were alert thresholds last reviewed against current system behavior? Alert logic that was accurate twelve months ago may be dangerously miscalibrated today. Establish a quarterly review cycle tied to capacity planning reviews.
3. Coverage Gap Analysis Map your log sources against your service dependency graph. Identify services that emit no structured logs, services that emit logs without standardized severity levels, and services whose log output is not routed to any alert logic. These are your blind spots.
4. Suppression Rate Monitoring Track the percentage of alerts that are acknowledged and immediately closed without action. A suppression rate above 40% is a signal that alert logic has lost operational relevance and requires redesign rather than incremental tuning.
5. Post-Mortem Attribution Analysis For every production incident in the past six months, determine whether the logging system contributed to detection, was neutral, or actively delayed detection. If more than one-third of incidents involved logging as a contributing factor to detection delay, the system has become a liability.
Structural Remediation Priorities
Teams that identify significant gaps through this framework face a common decision: expand tooling or restructure practice. The evidence generally favors the latter.
Investing in additional ingestion capacity before resolving alert logic debt is the engineering equivalent of adding lanes to a highway without addressing the bottleneck at the exit ramp. The throughput increases. The congestion persists.
Organizations that have successfully reduced MTTR through logging improvements share a common characteristic: they reduced the scope of what they monitored before expanding it. Curating log sources to prioritize high-signal services, implementing structured logging standards that enable consistent query patterns, and establishing explicit ownership of alert logic—these operational investments consistently outperform platform migrations in post-implementation measurement.
Conclusion
Log aggregation infrastructure is most dangerous not when it is absent, but when it is present and unexamined. The systems that collect without analyzing, that alert without discriminating, and that accumulate without pruning are not safety nets—they are technical debt with a latency problem.
For engineering organizations operating at scale in the US market, where infrastructure complexity and compliance requirements compound simultaneously, the gap between collection and intelligence is not an abstract concern. It is a measurable operational risk with a documented history of materializing at the worst possible moment. The diagnostic work required to close that gap is neither glamorous nor novel. It is, however, necessary.